Interactive annotations and shape drawing in plotly figures and Dash apps
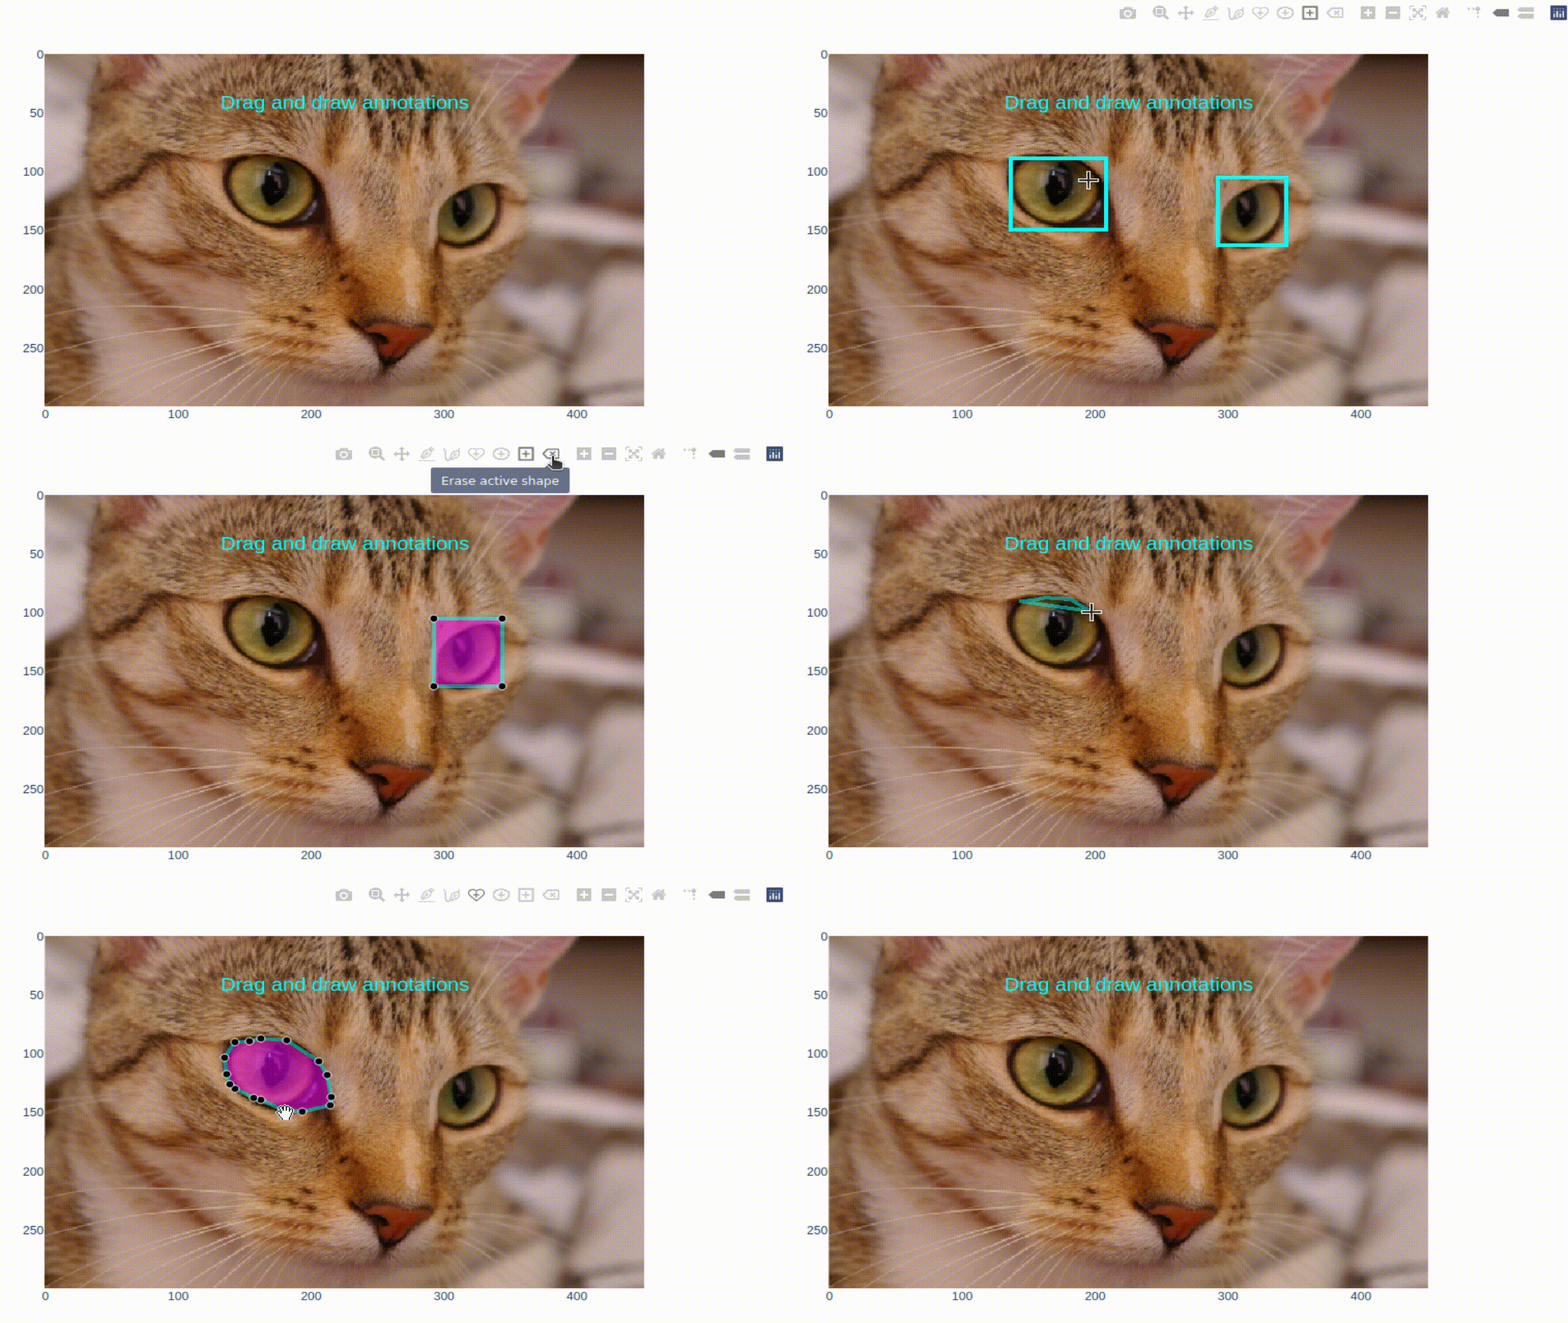
The new 4.7 release of plotly.py includes new layout dragmodes for users to be able to draw shapes such as rectangles, lines, open or closed paths etc. These shapes can also be modified or deleted when activated. In particular, this feature should make it easy to annotate images for measuring objects properties or building training sets for neural nets.

import plotly.express as px
from skimage import data
img = data.chelsea() # or any image represented as a numpy array
fig = px.imshow(img)
# Define dragmode, newshape parameters, amd add modebar buttons
fig.update_layout(
    dragmode='drawrect', # define dragmode
    newshape=dict(line_color='cyan'))
# Add modebar buttons
fig.show(config={'modeBarButtonsToAdd':['drawline',
                                        'drawopenpath',
                                        'drawclosedpath',
                                        'drawcircle',
                                        'drawrect',
                                        'eraseshape'
                                       ]})
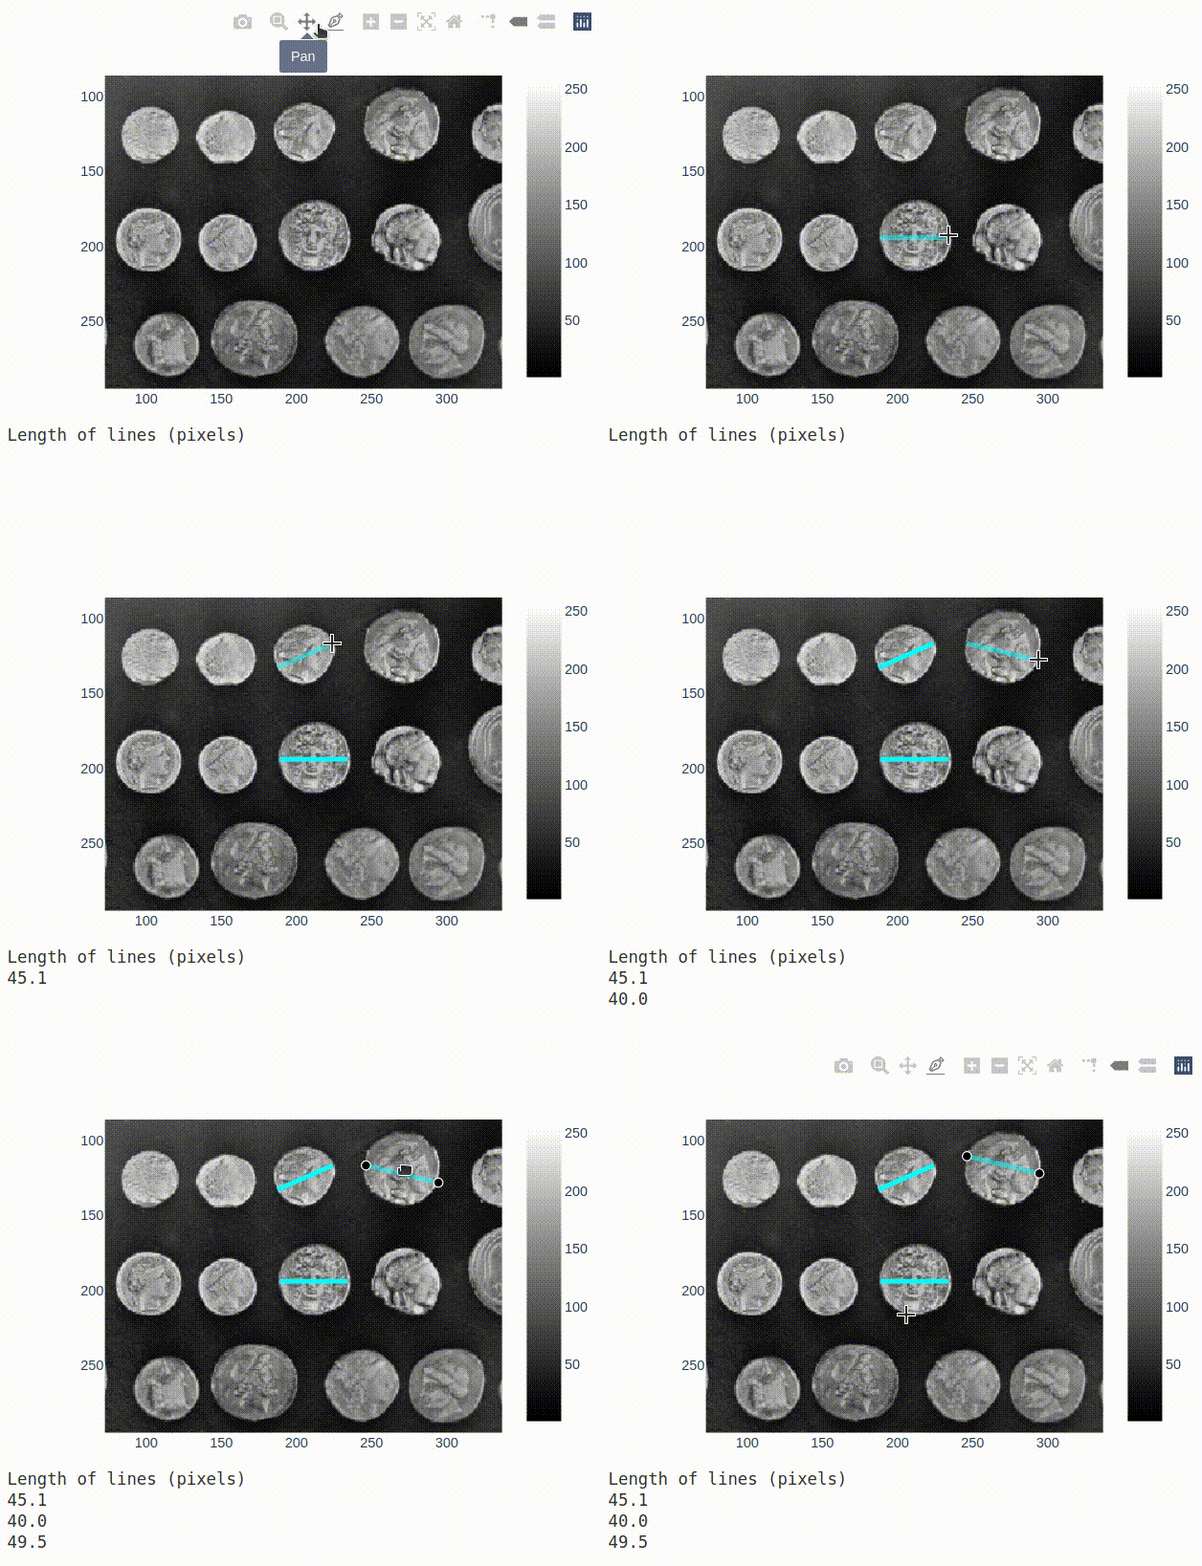
These new dragmodes are a keystone for our EOSS project on image processing, because they make it possible to build interactive applications with Dash which will use the annotations to perform various image processing tasks (measuring lengths as in the example below, defining markers for image segmentation, preparing a training set etc.).

As you can see from the code below, it only takes a few lines of code to write an interactive image processing app.
import dash
from dash.dependencies import Input, Output, State
import dash_html_components as html
import dash_core_components as dcc
import plotly.express as px
from skimage import data
import math

app = dash.Dash(__name__)

img = data.coins() # or any image represented as a numpy array

fig = px.imshow(img, color_continuous_scale='gray')
fig.update_layout(dragmode='drawline', newshape_line_color='cyan')

app.layout = html.Div(children=[
        dcc.Graph(
            id='graph',
            figure=fig,
            config={'modeBarButtonsToAdd':['drawline']}),
        html.Pre(id='content', children='Length of lines (pixels) \n')
        ], style={'width':'25%'})


@app.callback(
    dash.dependencies.Output('content', 'children'),
    [dash.dependencies.Input('graph', 'relayoutData')],
    [dash.dependencies.State('content', 'children')])
def shape_added(fig_data, content):
    if fig_data is None:
        return dash.no_update
    if 'shapes' in fig_data:
        line = fig_data['shapes'][-1]
        length = math.sqrt((line['x1'] - line['x0']) ** 2 +
                           (line['y1'] - line['y0']) ** 2)
        content += '%.1f'%length + '\n'
    return content


if __name__ == '__main__':
    app.run_server(debug=True)
New examples have been added to the plotly documentation about shape drawing:
- drawing shapes on Cartesian plots
- annotating layout images with shapes
- adding optional shape-drawing buttons to the modebar
See also