Faster image visualization for px.imshow

In the plotly visualization library,px.imshow is
the plotly express function for visualizing single-channel or multichannel (RGB) image data.
In plotly 4.10, we have added a new boolean keyword argument binary_string to px.imshow.
With binary_string=False (or before plotly 4.10), image data are passed as a
numerical array of floats when constructing the plotly figure object, which is
then passed to the browser for rendering the figure (a plotly
figure object is just a dictionary with a tree-like structure of attributes, which is transformed into a JSON string and passed to the plotly.js Javascript library, which runs in the browser). The browser then computes a mapping between data values and pixel colors, and renders pixels individually.
With binary_string=True, we use the fact that browsers are well optimized to
display image formats such as png or jpg. In the Python code of px.imshow,
numerical data are converted to a png Base64 string
and passed to the plotly image trace as its new source parameter, which the
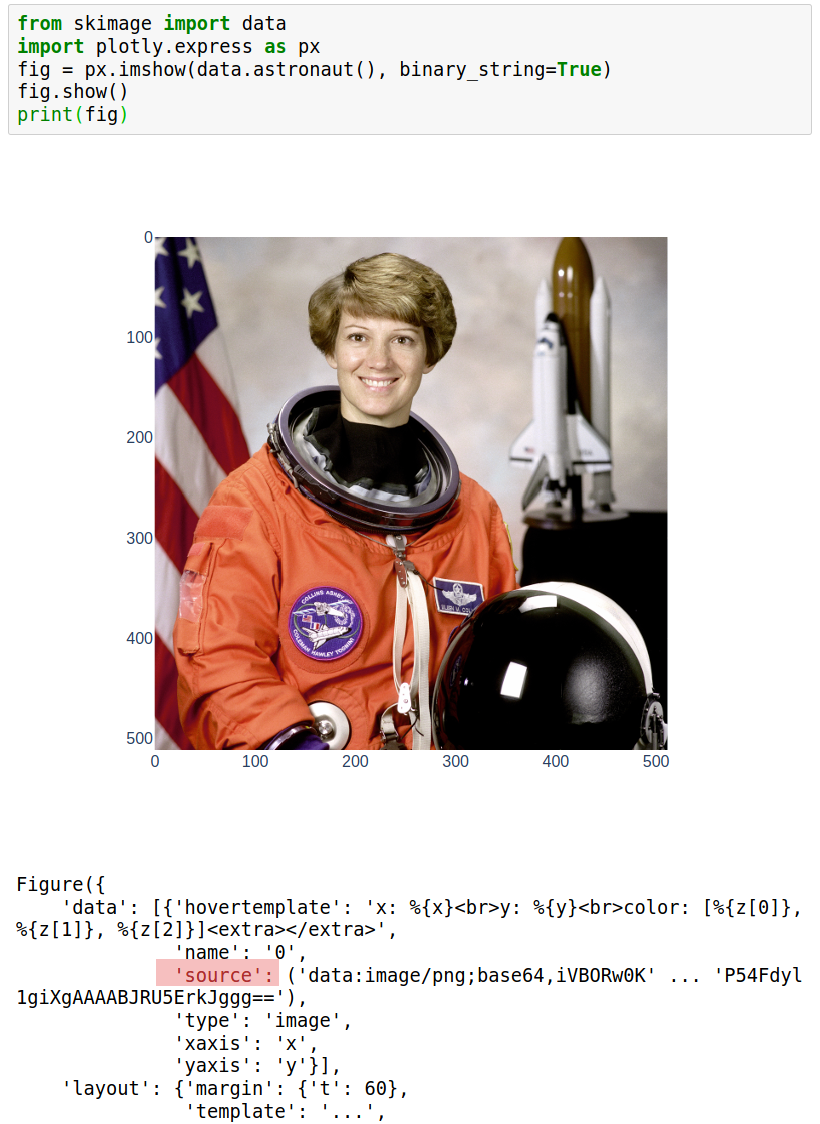
browser interprets as an image to be displayed. In the above screenshot, you
can see that the source parameter of go.Image is indeed a png binary string. This has several benefits:
- the rendering of large images is much faster than when drawn pixel by pixel
- the image size can be much smaller since png or jpg format use compression, so that you can save space when saving the figure to disk, or time when sending the JSON-stringified figure over the network in a Dash app. (In fact, the biggest gain in a Dash app comes from the fact than JSON serialization is much faster with the binary string).
In addition to binary_string, there are additional new optional arguments such as
binary_format (png or jpg), binary_compression_level and binary_backend, which all have sensible defaults. For more details on how to use these parameters you can read the imshow tutorial of the plotly documentation.
Since png or jpg images are encoded using unsigned 8 bit-integers (uint8, or
0-255), the conversion to a Base64 string is straightforward when input image data
are also using the uint8 data type. With other formats, it is often necessary to rescale the data so that they fit in the 0-255 range.
Rescaling can be performed using the zmin and zmax arguments of
px.imshow, or for automatic contrast rescaling, using the
contrast_rescaling argument, as explained in the documentation.
Note that for single-channel images (for example heatmaps), with binary_string=True the only available colormap is grayscale, and no colorbar will be displayed. Therefore using binary_string=True or False is a trade-off between performance and flexibility, and the default value for single-channel images is binary_string=False (while it is binary_string=True for multi-channel images). Also, with binary_string=True, when the data are rescaled you cannot see the original data in the hover (unless you pass them explicitly to the figure, using customdata), which is why we also kept the option binary_string=False for multichannel images.
We hope that you’ll like this more performant imshow! Comments and bug
reports are very welcome on the plotly.py github repo, while support should be
asked for in the community forum.