Dash app: exploration and semi-supervised segmentation of X-ray chest CT of COVID-19 patients
New app! https://dash-gallery.plotly.host/dash-covid-xray/
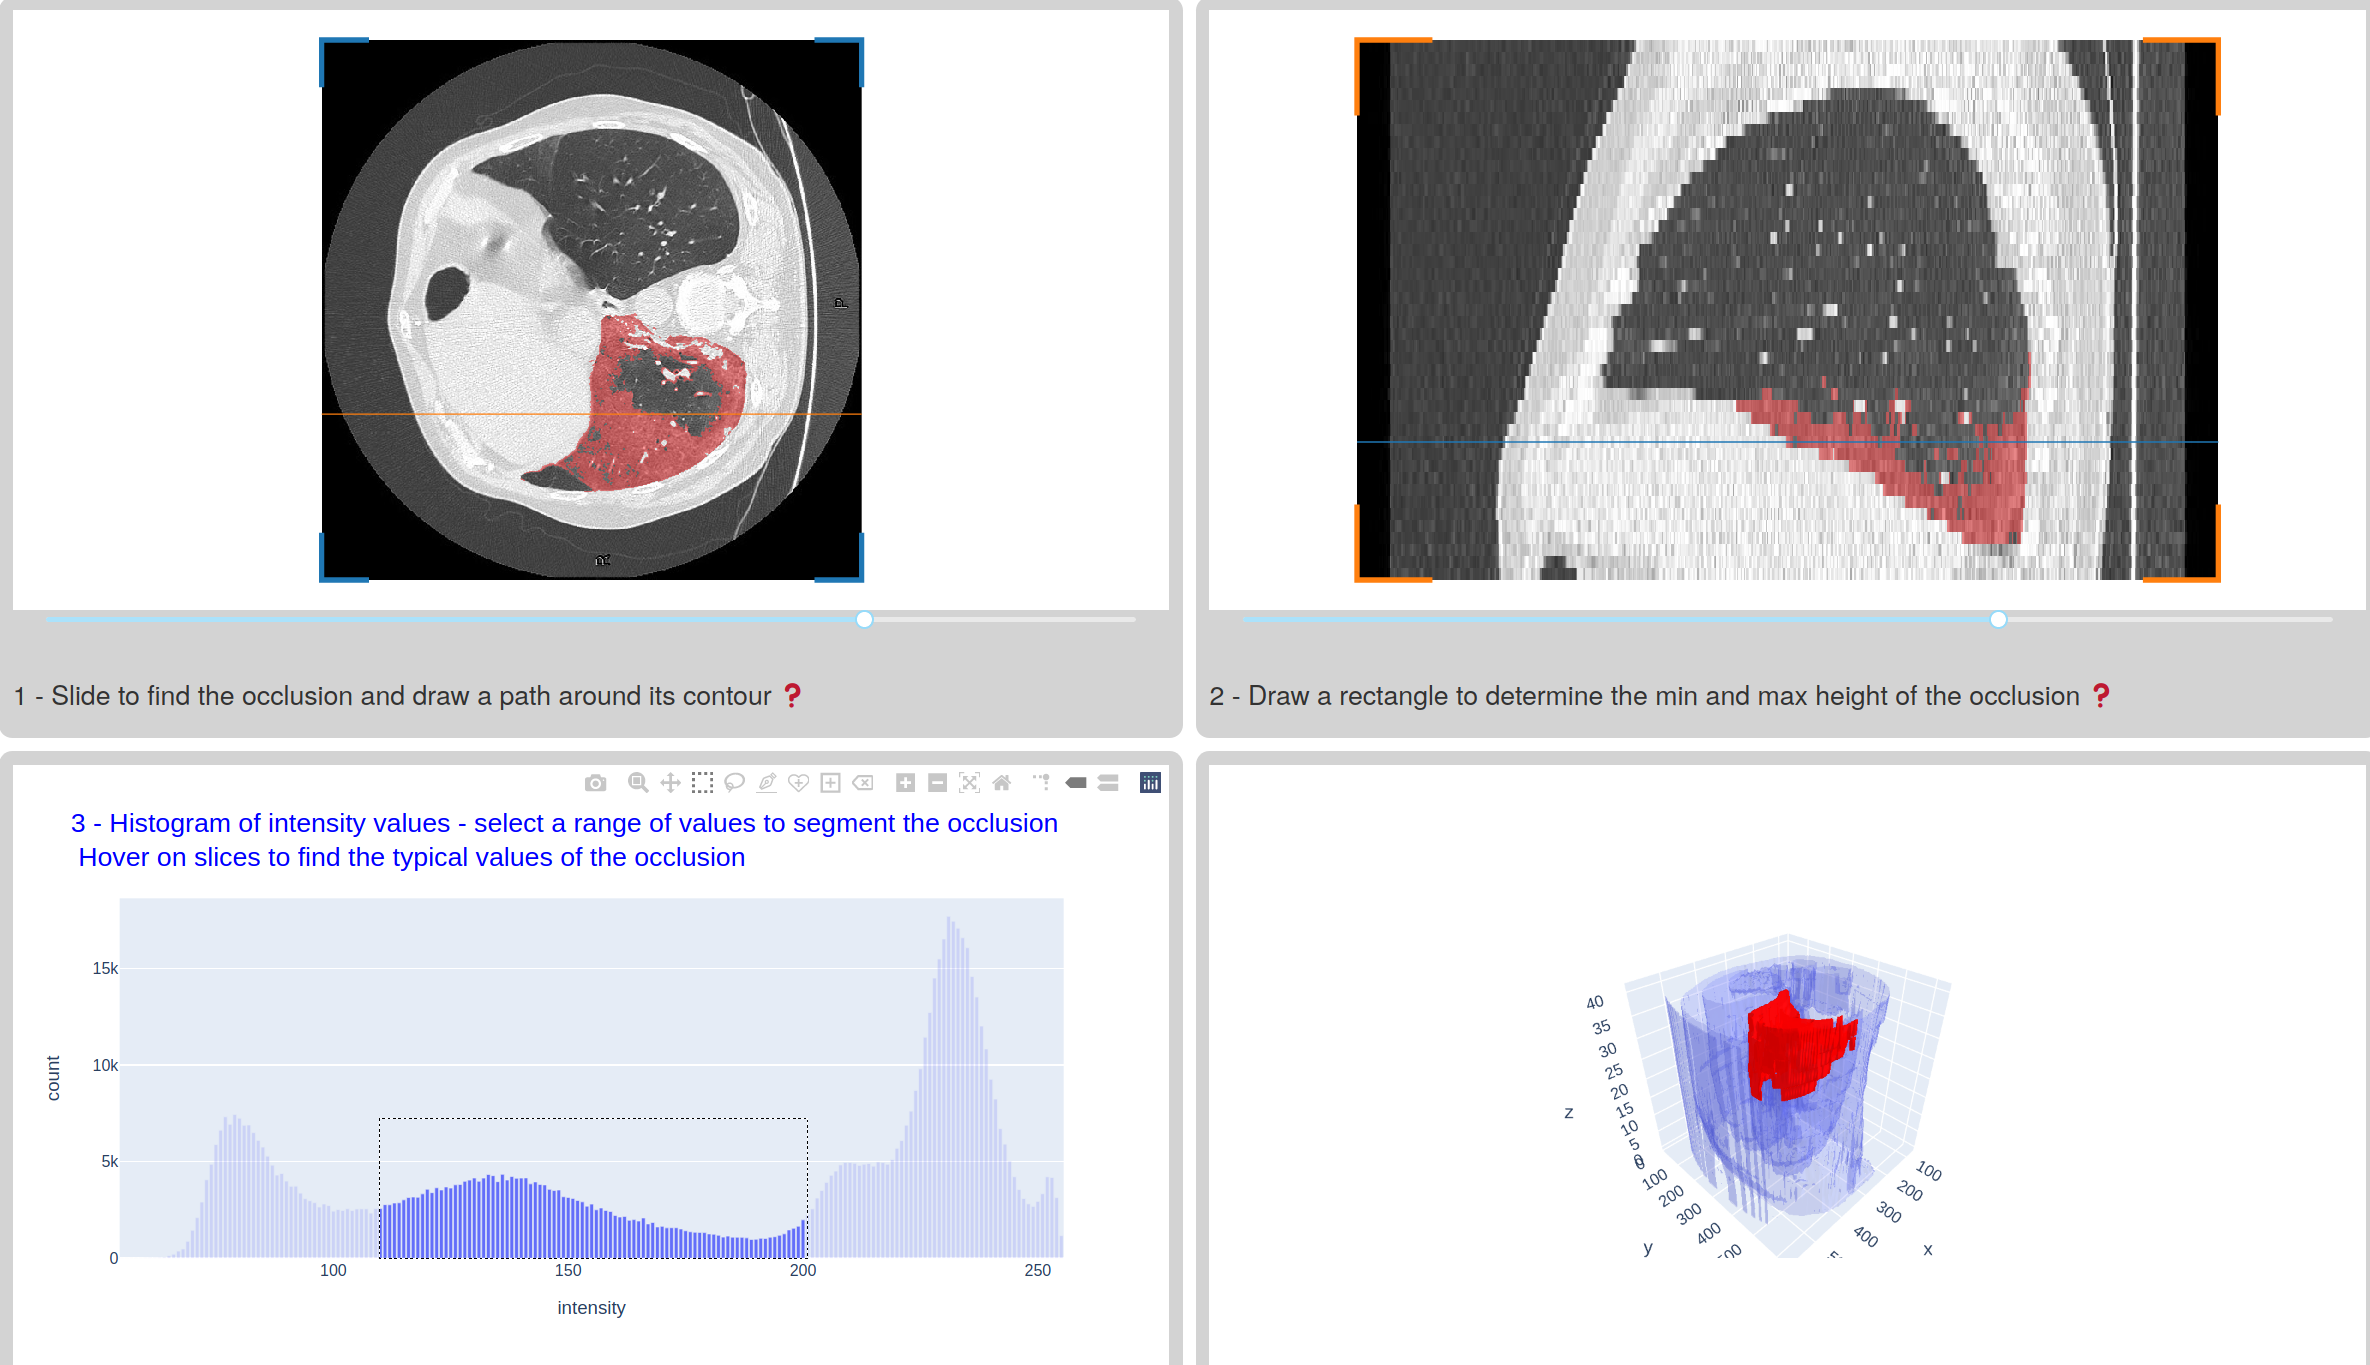
This new app is a typical example of how to asemble quickly a custom app for a custom medical imaging application. In this app, one is looking inside computed tomography image volumes for the ground-glass opacity (GGO) typically encountered in the lungs of patients with a severe form of Covid-19. The task is to extract the geometry of the GGO for patient diagnosis, and also to train machine learning models to analyze less rich data such as 2D radiographies (instead of 3D CT volumes).
dash-slicer, a new tool for visualizing 3D image data
A first challenge is to be able to navigate through the 3D image data. A common
way to visualize volumetric data is by slicing the data across one spatial
dimension, and scrolling through the different slices with a slider for
example. This kind of interaction can be implemented easily in Dash thanks to a
dcc.Graph, a dcc.Slider and a callback linking them. Things get a bit more
advanced, with more callbacks, when you want to have synchronized views across
different axes, or if you want to make the interaction super snappy thanks to
clientside callbacks. After having written this kind of callbacks many times,
we decided to encapsulate them in a new package called dash-slicer.
dash-slicer provides a meta-object DashSlicer, which attributes are Dash
components which you can put in the layout of your app, and which automatically
attaches to your app callbacks between the different components. Therefore,
slicing a 3D image along two views is as easy as
import dash
import dash_html_components as html
import imageio
from dash_slicer import VolumeSlicer

app = dash.Dash(__name__, update_title=None)

vol = imageio.volread("imageio:stent.npz")
slicer0 = VolumeSlicer(app, vol, axis=0)
slicer1 = VolumeSlicer(app, vol, axis=1)

app.layout = html.Div(
    style={
        "display": "grid",
        "gridTemplateColumns": "50% 50%",
    },
    children=[
        html.Div([slicer0.graph, html.Br(), slicer0.slider, *slicer0.stores]),
        html.Div([slicer1.graph, html.Br(), slicer1.slider, *slicer1.stores]),
    ],
)

if __name__ == "__main__":
    app.run_server(debug=True, dev_tools_props_check=False)
This is the full app! You can check out the documentation of dash-slicer to learn more about this new powerful tool.
Leveraging image annotations in plotly figures
Extracting the geometry of the GGO in a fully automatic way is a hard problem, so in this app we chose instead a semi-supervized approach, with the user selecting approximately a region of interest inside which histogram thresholding can be done. The selection of the region of interest is performed thanks to image annotations in the plotly figures of the slicers: a closed path selection and a rectangle selection.
scikit-image algorithms
In this app, we have also used some utility functions from the scikit-image
image processing package, in order to compute overlay masks from the plotly
annotations, to compute the histogram of intensity values in a region of
interest, or
to extract the surface
of the GGO. Since the app is
developed in pure Python, you can indeed use all your usual Pydata packages to
crunch data within callbacks!
What’s next?
We hope you enjoyed this app! Suggestions are welcome, and can be submitted via the source repo or on Twitter.
We will soon write about other apps related to 3D image exploration, so stay tuned!
You can read the documentation chapters of the Dash doc about
You might also want to check out some of the other image processing apps in the dash gallery:
- Interactive Image Segmentation
- 3-dimensional image annotation through superpixels
- Interactive image classification with the bounding box app (also check out the corresponding blog post).